Statistics
-Increased educational attainment among women has traditionally helped to narrow the gender income gap.
- In 1980, 17.8 per cent of Canadian women aged 25 to 29 employed on a full-time, full-year basis held a university degree. Although this proportion almost doubled to 34 per cent in 2000, there has been little change in the earnings ratios for this cohort.
-In 2005, the gender income gap was narrower for those new entrants that had achieved higher levels of education than for their less-educated counterparts:
- Women aged 25 to 29 holding a graduate or professional diploma and working on a full-time, full-year basis earned 96 cents for every dollar earned by their male counterparts in 2005.
- Women with a bachelor’s degree earned 89 cents for every dollar earned by their male counterparts.
- Women with a registered apprenticeship or trades certificate earned only 65 cents for every dollar earned by their male counterparts.
- Young women with no high school diploma earned 67 cents for every dollar earned by young men with the same level of education.
A look at math and science by grade and gender.
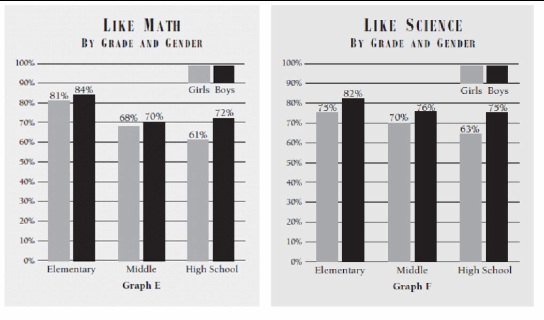
Fig 1. AAUW. (1994). Shortchanging Girls, Shortchanging America. http://www.aauw.org/learn/research/upload/SGSA-2.pdf
As boys and girls grow older, they begin to show less interest and a dislike for math and science. In comparison to males, females show more of a dislike over time.For example, in elementary school 81% of females like math, but this figure decreases to 61% when females reach high school. In science, the same trend continues as 75% of elementary school females say they like science. The percentage decreases as females enroll in high school where 63% of females say they like science.
Grade 3 EQAO results.
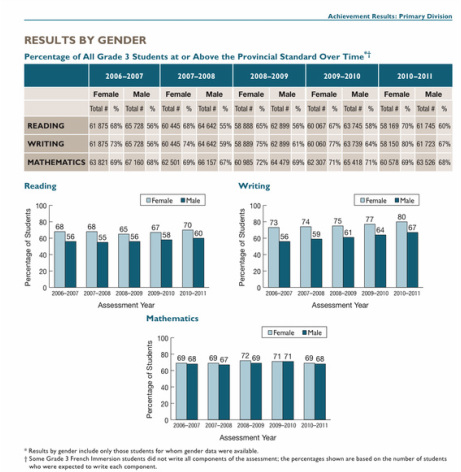
Fig.2 EQAO results for grade 3 students over the provincial standard represented by gender and subject area.
EQAO’s Provincial Elementary School Report:
Results of the 2010–2011 Assessments of Reading,
Writing and Mathematics, Primary Division
(Grades 1–3) and Junior Division (Grades 4–6). (pp.21).
As seen in the EQAO testing results from the 2010-2011 year, the gender gap has been in favour of female students in reading and writing. In mathematics, the percentage of female students at or above the standard is the same or slightly larger than males. (EQAO, 2011, p.21).
Grade 6 EQAO Results
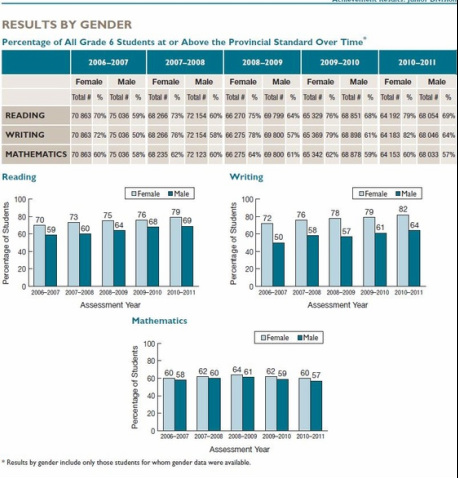
Fig.3 EQAO results for grade 6 students over the provincial standard represented by gender and subject area.
EQAO. (2011). EQAO’s Provincial Elementary School Report: Results of the 2010–2011 Assessments of Reading,
Writing and Mathematics, Primary Division
(Grades 1–3) and Junior Division (Grades 4–6). (pp.38).
The gender gap in favour of female students has remained relatively consistent and has been particularly pronounced in reading and writing. In 2010-2011, a larger percentage of female than male grade 6 students preformed at or above the provincial standard in each reading (79% versus 69%), writing (82% versus 64%) and mathematics (60% versus 57%). (EQAO, 2011 p. 38)
Assessment of Academic Grade 9 Mathematics
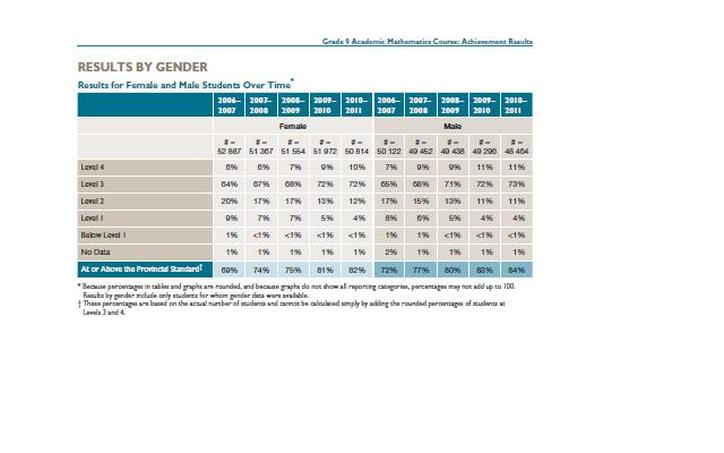
Fig.4 EQAO results for the Academic Grade 9 Mathematics course. EQAO. (2011). Ontario Student Achievement. EQAO's Secondary School Report. (pp.17).
StatsCan Degrees Granted at the Undergraduate level.
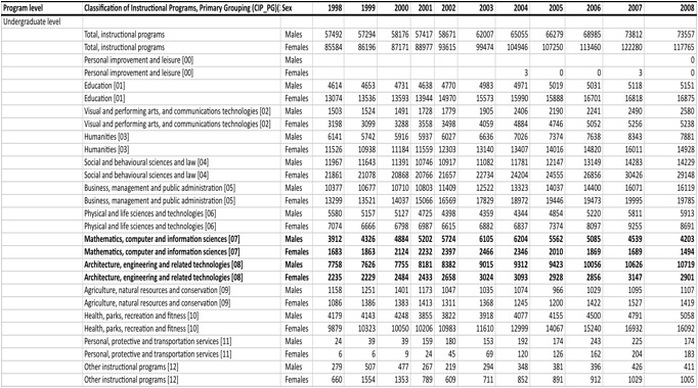
Fig. 5 Degrees granted in Canada from 1998 to 2008 .
Statistics Canada. University degrees, diplomas and certificates granted by program level, classification of instructional programs, primary grouping (CIP_PG) and sex 1998-2008 Canada (table 477-0014). Using E-STAT. Last updated July 13 2010).http://estat.statcan.gc.ca/cgi-win/cnsmcgi.pgm?regtkt=&C2Sub=&ARRAYID=4770014&C2DB=EST&VEC=&HILITE=DEGREES+GRANTED&LANG=E&SrchVer=&ChunkSize=50&SDDSLOC=//www.statcan.gc.ca/imdb-bmdi/*-eng.htm&ROOTDIR=ESTAT/&RESULTTEMPLATE=ESTAT/CII_PICK&ARRAY_PICK=1&SDDSID=&SDDSDESC=(accessed October 13 2011).
This table from StatsCan displays undergraduate degrees granted during a ten year spread from 1998 to 2008. Females are graduating with more degrees than males and represent the majority of graduates. Males however, graduate from mathematics, computer, information sciences, architecture, engineering and other related technological programs in higher numbers.
StatsCan Degrees Granted at the Post-Graduate level.
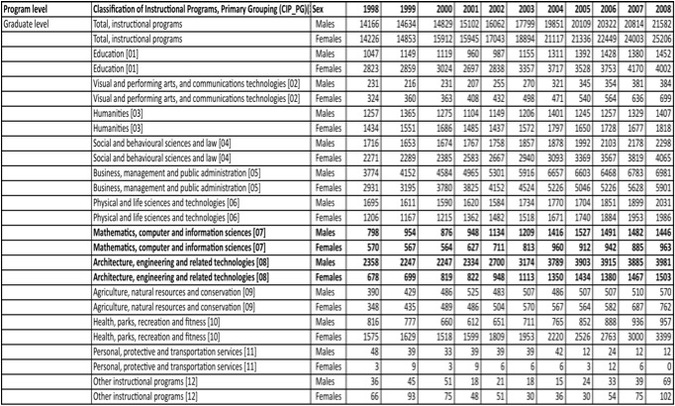
Fig. 6 Post graduate degrees granted in Canada from 1998 to 2008 .
Statistics Canada. University degrees, diplomas and certificates granted by program level, classification of instructional programs, primary grouping (CIP_PG) and sex 1998-2008 Canada (table 477-0014). Using E-STAT. Last updated July 13 2010).http://estat.statcan.gc.ca/cgi-win/cnsmcgi.pgm?regtkt=&C2Sub=&ARRAYID=4770014&C2DB=EST&VEC=&HILITE=DEGREES+GRANTED&LANG=E&SrchVer=&ChunkSize=50&SDDSLOC=//www.statcan.gc.ca/imdb-bmdi/*-eng.htm&ROOTDIR=ESTAT/&RESULTTEMPLATE=ESTAT/CII_PICK&ARRAY_PICK=1&SDDSID=&SDDSDESC=(accessed October 13 2011).
This table from StatsCan displays masters and doctorate degrees granted during a ten year spread from 1998 to 2008. Females are graduating with more graduate level degrees than males and represent the majority of graduates. Males however, graduate from mathematics, computer, information sciences, architecture, engineering and other related technological programs in higher numbers.
